Best Candlestick Patterns Forex 2022
Hi Despicable robot is back with another blog in forex trading series. In this blog we will discuss best candlestick patterns forex 2022. Before we move on towards the details below are some of the links of our previous blogs. I request you to read them and share it with your friends. Thankyou
- Top 5 NFT marketplaces to buy and sell
- What is an NFT A Beginner Explanation
- Best Samsung Smartwatches in 2022
- Top best 5 Gaming Keyboards
- Top best angle grinder 2022
- Top 5 best laptop stands in 2022
In the previous blog of the series we discussed about what is forex trading in layman terms and how we can earn money from it. We also discussed the do’s and don’t of a beginner and what mistakes a newbie should avoid. We will discuss candlestick chart forex in this blog.
What are candlestick chart forex?

It is a Japanese method to predict the future price movement of an asset based on its previous price. It is plotted as a candlestick on a chart, e.g. a stock chart. The white candles are those where the closing price is more than the opening price. A black candle is plotted when the closing price is less than the opening. There can be a wick, just like in a real candle. The top of the upper wick is the highest price, whereas the bottom of the lower wick is the lowest price of the candle period you selected.
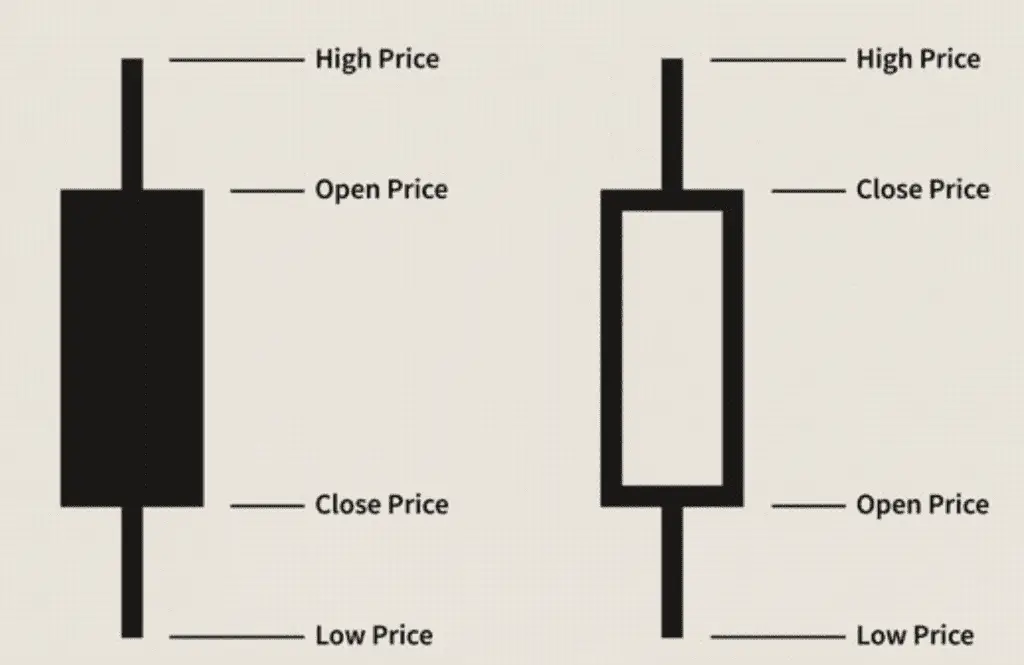
Candlestick charts are handy and straightforward to understand, and traders use them to predict future market changes based on past patterns. They’re convenient because they show the four price points (open, closing, high, and low) over the period that a trader specifies. Candlestick patterns in forex trading describe a price movement that is depicted graphically. They help project future price changes in the market since they provide price points (open, close, high, and low) over the period that the trader has set.
The importance of candlestick patterns in forex trading is very high. Using candlestick patterns, forex traders can easily find potential trading opportunities. Candlestick patterns are based on historical price data along with market trends. Forex traders use them to predict future price movements based on past price action.
Forex candlesticks explained
Open price: The open price depicts the first traded price during the formation of a new candle.
High price: The top of the upper wick.
Low price: The bottom of the lower wick.
Close price: The close price is the last price traded during the formation of the candle.
Why use candlestick chart forex
- Candlestick charts are a type of technical chart that condenses data from multiple time frames into a single price bar. As a result, they are more useful than traditional open-high, low-close bars or simple lines connecting closing price dots.
- Candlestick charts are popular among cryptocurrency traders due to their simplicity and visual appeal.
- A candlestick represents the price activity of an asset over a given time period. Traders can examine different time periods depending on whether they are making low or high timeframe decisions
- Each candlestick can be programmed to represent any time period, from a single minute to an entire month.
- Candlesticks are made up of four major parts: the high, low, open, and close.
- Candlestick patterns provide cryptocurrency traders with more information about the potential moves that are expected to occur next. In other words, they serve as trading signals, advising traders on when to open long or short positions or exit the market.
- Swing traders, for example, use candlestick charts to determine reversal or continuation trading patterns. They assist traders in determining trends, understanding momentum, and real-time market sentiment.
- When trading, the “open” price of an asset is the price at the start of the trading period, and the “close” price is the price at the end of the trading period.
- The terms “high and low” refer to the asset’s highest and lowest prices during the trading session.
- Although there are many other types of charts like bar and line charts, candlestick charts stand out as the best tool for technical analysis in forex.
Best Candlestick Patterns
Candlestick patterns are also known as Japanese candlestick patterns because they’re first developed by Japanese rice traders in the 1700s. These traders traded currency even before digital platforms were developed and they used candlestick charts as their main tool for technical analysis.Candlestick patterns are technical tools that collect data for several time frames into single price bars. They aid in predicting the price direction.
The best candlestick patterns for trading forex depends on your trading style and what you are trying to accomplish in your trading .
The best candlestick patterns for trading are:
- Doji
- Hammer
- Bullish and Bearish
- Dark Cloud Cover
- Piercing Pattern
- Inside Bars
- Long Wicks
- Shooting Star
We will explain each of these candlesticks patterns in some other blog.
Why traders prefer candlestick chart forex?
- It determines the current state of the market at once.
- The colours used in the candlesticks determine easily whether the market is bullish or bearish.
- It helps determine the direction of the market easily.
- A trader can identify patterns quickly.
- Candlesticks display specific bullish and bearish reversal patterns that cannot be seen on other charts.
- Japanese candlesticks have become the standard chart among forex traders as they highlight opening and closing prices of different time periods better than traditional charts.
- They are useful for not just identifying ongoing trends but also for predicting upcoming market trends.
- The forex market is driven by price and candlestick charts were invented for the very purpose of tracking price movements in a market. And this is why candlestick charts are considered ideal by forex traders.
- Using candlestick patterns, forex traders can easily find potential trading opportunities.
FAQ’S
In layman terms what is candlestick patterns and how they help in trading?
Suppose you go to a market to buy potatoes, and there are 5 more people besides you who are buying potatoes. The current price is 15$, but buyers ask for different prices, such as 5$, 7$, 8$, and 9$. The sellers are resisting the price drop, and they agree to 14,13,12, and some are demanding 20$. It can be shown in a candle stick below.
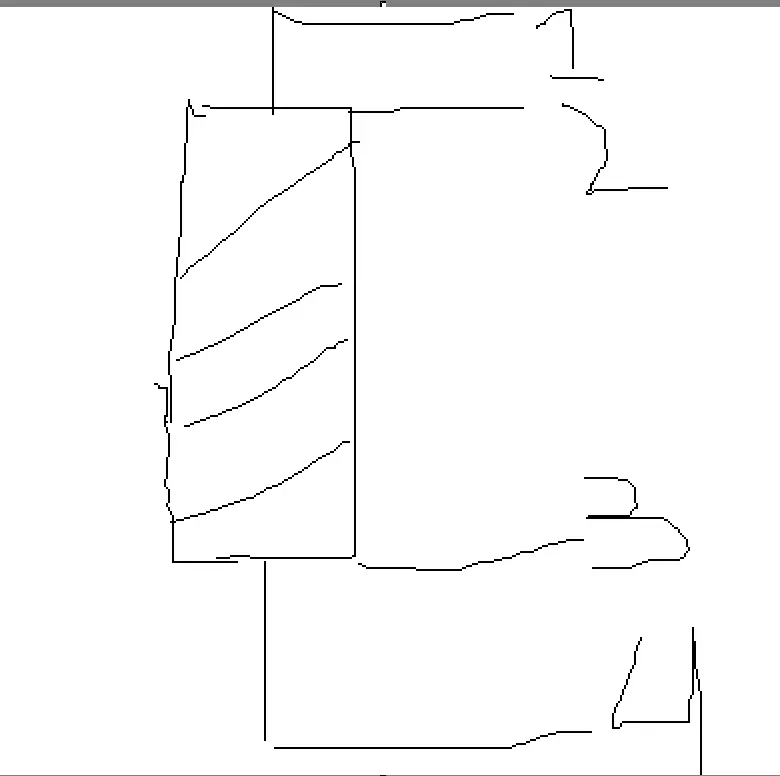
- 1 means maximum demanded price which is 20$ but it was not agreed.
- 2 means maximum price agreed which is 15$
- 3 means minimum price agreed which is 12$.
- 4 means minimum price which was asked but not agreed which is 5,7,8 and 9$.
What are some basic candlestick patterns for a newbie to learn?
Below is a list of some basic candlestick chart pattern which a beginner should learn
- Bullish Marubuzo and Bearish Marubuzo
- Spinning Top
- Doji
- Paper Umbrella
- Shooting Star
- Bullish Engulfing and Bearish Engulfing
- Bullish Harami and Bearish Harami
- Morning Star
- Evening Star
Are candlestick reliable in forex trading?
Candlestick patterns are the most reliable and essential tools for conducting technical analysis. Traders with a proper understanding of the candlestick patterns can easily interpret the market trends and make decisions based on these interferences. Candlestick patterns allow traders to depict the market movement as either a bullish, bearish or sideways trend.
What open close high and low mean in candlestick chart?
Open price: The open price depicts the first traded price during the formation of a new candle
High price: The top of the upper wick.Low price: The bottom of the lower wick.
Close price: The close price is the last price traded during the formation of the candle
.
